Pacific Black Duck
Anas superciliosa
ABR description
The following is extracted from the Annual Bird Report for the twelve months to June 2017.
Very common, breeding resident
A very familiar duck in the region.
General: Similar indices to last year (abundance, reporting rate, average and median numbers of birds). These indices have remained relative stable since the increase in 2010-11. There was an increase in the distribution (121 grid cells cf 105 last year) and a large increase in the maximum number seen 450/17 Apr BuTYL GrS13 (MaL2). As with Grey Teal, there was a large increase in the number of breeding records (211 cf 96 last year) 202 records of dy. Breeding observations throughout the year apart from July 2016 and May-June 2017.
GBS: 327 records, down from 384 last year, else all indices very similar to last year. Reported from 18 sites with a maximum of 60/3wk May Giralang (McD4). 29 breeding records (all dy) apart from a single observation of co/4wk Aug Red Hill Gr (WaR4). Records from 7 sites: Red Hill, Giralang (McD4), Burra GrM20, (AnI1), Bonner GrL10 (GrB1), Wamboin GrQ12 (CoK2), Jerrabomberra GrM16 (HaL2) and Crace GrK11 (LeF1).
Abundance
Abundance is the average number of birds of that species per survey. Where the species was observed (presence recorded) but the number of birds seen was not recorded, this is treated as a count of zero.
Abundance by year
This chart shows the abundance of Pacific Black Duck between 1982 and 2017. 
Abundance by month
This chart shows the monthly abundance of Pacific Black Duck. The blue lines show the abundance for the twelve months to June 2017 and the bars show the average abundance for the period 1982 to 2017. 
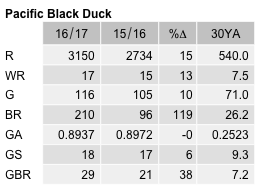
Abundance by season
This chart shows the seasonal abundance of Pacific Black Duck. The blue lines show the seasonal abundance for the twelve months to June 2017 and the bars show the average seasonal abundance for the period 1982 to 2017. 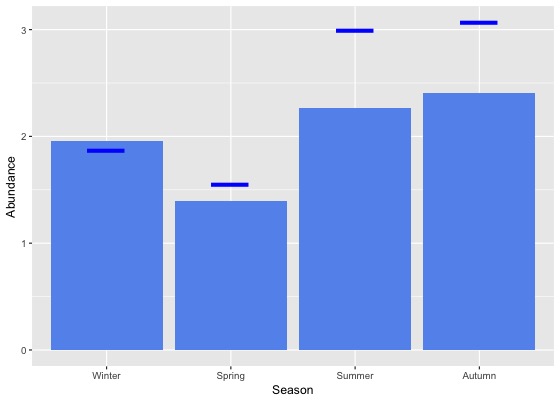
Abundance data
| Month | Season | ||||||||||||||||||
|---|---|---|---|---|---|---|---|---|---|---|---|---|---|---|---|---|---|---|---|
| Period | Jul | Aug | Sep | Oct | Nov | Dec | Jan | Feb | Mar | Apr | May | Jun | Winter | Spring | Summer | Autumn | All | ||
| All years | |||||||||||||||||||
| All | 1.9 | 1.8 | 1.1 | 1.5 | 1.6 | 1.8 | 2.3 | 2.8 | 1.9 | 2.7 | 2.7 | 2.1 | 2.0 | 1.4 | 2.3 | 2.4 | 2.0 | ||
| Previous years | |||||||||||||||||||
| All previous years | 2.0 | 2.0 | 1.1 | 1.5 | 1.5 | 1.7 | 2.2 | 2.7 | 1.8 | 2.5 | 2.8 | 2.0 | 2.0 | 1.4 | 2.1 | 2.3 | 1.9 | ||
| Previous 30 years | 2.0 | 1.8 | 1.1 | 1.4 | 1.5 | 1.5 | 2.2 | 2.4 | 1.8 | 2.2 | 2.7 | 1.7 | 1.8 | 1.3 | 2.0 | 2.2 | 1.8 | ||
| Previous 20 years | 2.1 | 1.9 | 1.1 | 1.4 | 1.3 | 1.3 | 1.9 | 2.0 | 1.5 | 1.8 | 2.7 | 1.4 | 1.7 | 1.3 | 1.7 | 1.9 | 1.6 | ||
| 10 year groups | |||||||||||||||||||
| [2007,2017) | 2.6 | 2.2 | 1.3 | 1.5 | 1.6 | 1.5 | 2.1 | 2.1 | 1.8 | 2.2 | 3.4 | 1.9 | 2.1 | 1.5 | 1.9 | 2.4 | 1.9 | ||
| [1997,2007) | 1.2 | 1.2 | 0.6 | 0.9 | 0.8 | 0.8 | 1.4 | 1.9 | 0.7 | 0.7 | 1.0 | 0.6 | 0.9 | 0.8 | 1.3 | 0.8 | 0.9 | ||
| [1987,1997) | 1.6 | 1.7 | 1.2 | 1.8 | 1.9 | 2.9 | 3.6 | 4.3 | 3.4 | 4.7 | 2.5 | 2.8 | 2.0 | 1.7 | 3.6 | 3.6 | 2.6 | ||
| 5 year groups | |||||||||||||||||||
| [2012,2017) | 3.2 | 2.6 | 1.6 | 1.7 | 1.8 | 1.7 | 2.1 | 2.3 | 2.1 | 2.5 | 3.8 | 2.1 | 2.6 | 1.7 | 2.0 | 2.7 | 2.2 | ||
| [2007,2012) | 0.7 | 0.7 | 0.6 | 1.2 | 0.8 | 1.1 | 2.2 | 0.9 | 1.1 | 1.5 | 2.5 | 1.5 | 1.1 | 1.0 | 1.5 | 1.6 | 1.2 | ||
| [2002,2007) | 1.0 | 1.1 | 0.5 | 0.7 | 0.6 | 0.6 | 1.3 | 1.6 | 0.5 | 0.9 | 1.0 | 0.4 | 0.8 | 0.6 | 1.1 | 0.8 | 0.8 | ||
| [1997,2002) | 1.5 | 1.4 | 0.7 | 1.2 | 1.0 | 1.1 | 1.4 | 2.1 | 1.0 | 0.5 | 1.1 | 0.8 | 1.2 | 1.0 | 1.5 | 0.8 | 1.1 | ||
| [1992,1997) | 4.1 | 3.4 | 2.4 | 2.8 | 3.4 | 3.6 | 4.9 | 5.3 | 4.4 | 6.0 | 3.6 | 4.9 | 4.1 | 2.9 | 4.6 | 4.7 | 4.0 | ||
| [1987,1992) | 0.5 | 0.7 | 0.6 | 1.2 | 1.2 | 2.6 | 2.9 | 3.9 | 2.9 | 3.9 | 1.9 | 1.6 | 0.9 | 1.0 | 3.1 | 2.9 | 1.9 | ||
| Year | |||||||||||||||||||
| 2017 | 1.2 | 1.2 | 1.1 | 1.6 | 1.9 | 2.5 | 3.0 | 3.4 | 2.6 | 4.5 | 2.2 | 2.7 | 1.9 | 1.6 | 3.0 | 3.1 | 2.4 | ||
| 2016 | 2.9 | 2.3 | 1.7 | 2.0 | 2.5 | 2.3 | 2.3 | 2.3 | 1.9 | 2.8 | 3.9 | 1.8 | 2.3 | 2.0 | 2.3 | 2.8 | 2.3 | ||
| 2015 | 3.8 | 3.2 | 2.1 | 1.9 | 1.9 | 1.7 | 1.9 | 2.2 | 2.0 | 2.0 | 3.8 | 2.2 | 2.9 | 2.0 | 2.0 | 2.5 | 2.3 | ||
| 2014 | 4.9 | 3.5 | 1.5 | 1.5 | 1.9 | 1.2 | 2.5 | 3.6 | 3.6 | 2.9 | 3.8 | 2.0 | 3.0 | 1.6 | 2.6 | 3.4 | 2.6 | ||
| 2013 | 2.6 | 2.6 | 1.0 | 1.2 | 1.3 | 1.2 | 1.9 | 2.0 | 1.4 | 2.6 | 2.8 | 3.2 | 2.9 | 1.2 | 1.6 | 2.1 | 1.8 | ||
| 2012 | 2.6 | 1.8 | 1.1 | 1.4 | 1.0 | 1.2 | 1.4 | 0.9 | 2.1 | 1.6 | 4.1 | 1.5 | 1.9 | 1.2 | 1.3 | 2.3 | 1.6 | ||
| 2011 | 1.6 | 0.8 | 0.5 | 0.9 | 1.0 | 3.1 | 2.8 | 0.7 | 0.6 | 2.4 | 4.0 | 3.6 | 2.6 | 0.8 | 2.4 | 2.3 | 2.0 | ||
| 2010 | 0.4 | 0.5 | 0.5 | 1.0 | 0.6 | 0.4 | 2.0 | 1.2 | 1.1 | 1.3 | 1.6 | 0.4 | 0.4 | 0.8 | 1.1 | 1.3 | 0.9 | ||
| 2009 | 1.0 | 1.4 | 0.8 | 1.1 | 0.5 | 0.2 | 1.8 | 0.7 | 1.8 | 1.0 | 0.8 | 0.7 | 0.9 | 0.9 | 0.9 | 1.2 | 1.0 | ||
| 2008 | 0.1 | 0.6 | 0.7 | 1.4 | 1.1 | 0.2 | 2.4 | 0.8 | 0.6 | 1.2 | 1.1 | 0.6 | 0.4 | 1.1 | 1.0 | 1.0 | 0.9 | ||
| 2007 | 0.6 | 0.2 | 0.3 | 1.5 | 1.0 | 0.7 | 1.7 | 1.1 | 1.5 | 1.4 | 3.0 | 1.2 | 0.9 | 1.1 | 1.2 | 1.8 | 1.2 | ||
| 2006 | 0.8 | 2.2 | 0.7 | 1.0 | 0.5 | 0.2 | 2.2 | 1.8 | 0.7 | 1.0 | 0.9 | 0.2 | 0.8 | 0.8 | 1.4 | 0.8 | 0.9 | ||
| 2005 | 1.6 | 1.5 | 0.7 | 0.6 | 0.8 | 0.7 | 0.9 | 1.2 | 0.3 | 0.4 | 0.8 | 0.1 | 0.8 | 0.7 | 0.8 | 0.5 | 0.7 | ||
| 2004 | 1.3 | 0.9 | 0.5 | 0.6 | 0.9 | 0.6 | 0.8 | 3.8 | 0.8 | 0.4 | 1.3 | 0.7 | 1.0 | 0.7 | 1.3 | 0.8 | 0.9 | ||
| 2003 | 0.8 | 0.9 | 0.4 | 0.5 | 0.5 | 0.6 | 1.0 | 1.2 | 0.5 | 1.4 | 1.4 | 0.6 | 0.8 | 0.5 | 0.9 | 1.0 | 0.8 | ||
| 2002 | 0.2 | 0.4 | 0.4 | 0.6 | 0.4 | 0.8 | 1.6 | 0.7 | 0.3 | 1.1 | 0.8 | 0.5 | 0.4 | 0.5 | 1.0 | 0.7 | 0.6 | ||
| 2001 | 0.5 | 0.4 | 0.3 | 0.6 | 0.7 | 0.1 | 0.9 | 1.5 | 0.9 | 0.4 | 0.4 | 0.4 | 0.4 | 0.5 | 0.7 | 0.6 | 0.6 | ||
| 2000 | 2.0 | 2.4 | 0.7 | 1.1 | 1.5 | 0.7 | 0.9 | 0.9 | 0.4 | 0.4 | 0.4 | 0.2 | 1.4 | 1.1 | 0.8 | 0.4 | 0.9 | ||
| 1999 | 1.0 | 1.3 | 0.5 | 1.2 | 0.9 | 2.5 | 1.8 | 0.9 | 1.9 | 0.2 | 2.3 | 1.9 | 1.7 | 0.8 | 1.8 | 1.5 | 1.4 | ||
| 1998 | 0.3 | 1.2 | 1.8 | 1.4 | 0.6 | 0.9 | 3.8 | 5.4 | 0.5 | 1.8 | 0.9 | 0.9 | 0.9 | 1.3 | 2.8 | 0.9 | 1.5 | ||
| 1997 | 4.1 | 2.0 | 0.8 | 3.3 | 1.3 | 3.1 | 1.0 | 8.9 | 2.7 | 0.7 | 0.5 | 0.4 | 2.3 | 1.6 | 4.2 | 1.1 | 2.2 | ||
| 1996 | 3.6 | 1.8 | 1.7 | 1.6 | 1.7 | 1.5 | 3.4 | 3.6 | 2.9 | 3.8 | 3.4 | 4.0 | 3.0 | 1.7 | 2.8 | 3.3 | 2.6 | ||
| 1995 | 6.9 | 6.6 | 3.9 | 3.0 | 3.6 | 7.9 | 4.7 | 5.1 | 6.7 | 7.4 | 4.1 | 2.0 | 5.3 | 3.4 | 5.9 | 6.3 | 5.1 | ||
| 1994 | 3.3 | 2.2 | 1.0 | 1.7 | 3.1 | 1.3 | 4.0 | 1.9 | 5.8 | 4.8 | 1.6 | 6.5 | 4.2 | 2.2 | 2.6 | 4.3 | 3.4 | ||
| 1993 | 2.2 | 2.2 | 1.8 | 2.2 | 3.3 | 2.2 | 4.6 | 19.2 | 2.3 | 10.3 | 4.4 | 9.5 | 4.8 | 2.5 | 7.4 | 5.2 | 4.7 | ||
| 1992 | 2.6 | 2.2 | 2.8 | 5.3 | 6.1 | 3.6 | 9.4 | 3.0 | 4.3 | 3.8 | 4.6 | 2.8 | 2.5 | 4.7 | 5.5 | 4.3 | 4.3 | ||
| 1991 | 0.8 | 1.3 | 1.3 | 3.8 | 7.5 | 9.9 | 26.9 | 21.2 | 5.4 | 9.8 | 9.0 | 3.5 | 1.4 | 4.3 | 18.3 | 8.0 | 6.9 | ||
| 1990 | 0.8 | 0.4 | 1.7 | 1.9 | 2.7 | 8.7 | 4.7 | 12.7 | 8.2 | 9.9 | 3.2 | 3.0 | 1.0 | 2.1 | 8.7 | 7.3 | 4.0 | ||
| 1989 | 0.3 | 0.8 | 0.3 | 1.2 | 0.3 | 1.5 | 0.3 | 2.3 | 5.3 | 5.8 | 3.2 | 1.3 | 0.8 | 0.7 | 1.4 | 4.9 | 1.8 | ||
| 1988 | 0.2 | 0.5 | 0.4 | 0.7 | 0.3 | 1.0 | 0.3 | 0.8 | 0.2 | 1.1 | 0.2 | 0.8 | 0.5 | 0.4 | 0.7 | 0.5 | 0.5 | ||
| 1987 | 1.9 | 4.1 | 0.3 | 0.5 | 0.3 | 0.7 | 0.6 | 1.2 | 0.3 | 1.0 | 0.3 | 1.5 | 1.7 | 0.4 | 0.9 | 0.5 | 0.7 | ||
| 1986 | 1.0 | 4.8 | 1.4 | 7.4 | 1.5 | 5.8 | 2.2 | 10.3 | 3.9 | 7.8 | 2.3 | 10.9 | 6.0 | 3.0 | 6.7 | 5.3 | 5.0 | ||
| 1985 | 3.4 | 3.7 | 1.2 | 1.7 | 3.2 | 7.8 | 17.9 | 23.7 | 7.9 | 16.8 | 5.9 | 19.1 | 8.5 | 2.0 | 11.9 | 11.7 | 6.4 | ||
| 1984 | 5.4 | 8.6 | 0.8 | 9.5 | 7.8 | 20.2 | 1.5 | 9.7 | 0.2 | 18.4 | 6.1 | 16.7 | 13.9 | 7.1 | 8.2 | 8.9 | 9.6 | ||
| 1983 | 19.0 | 34.3 | 9.2 | 24.0 | 10.8 | 26.9 | 2.7 | 22.5 | 0.5 | - | 26.7 | 11.5 | 22.5 | 16.9 | 20.4 | 22.9 | 20.4 | ||
| 1982 | - | 8.4 | - | 0.0 | 13.5 | 13.4 | - | 41.5 | - | 42.2 | - | 50.0 | 31.7 | 12.0 | 25.7 | 42.2 | 29.1 | ||
Reporting rates
Reporting rate is the proportion of all surveys in which the species was present.
Reporting rate by year
This chart shows the reporting rate of Pacific Black Duck each year between 1982 and 2017. 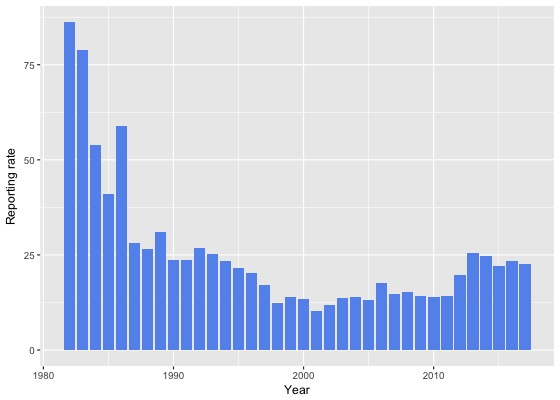
Reporting rate by month
This chart shows the reporting rate by month of Pacific Black Duck. The blue lines show the reporting rate for the twelve months to June 2017 and the bars show the average reporting rate for the period 1982 to 2017. 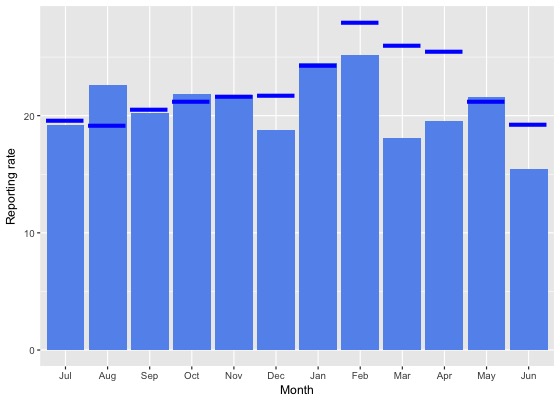
Reporting rate by season
This chart shows the seasonal reporting rate of Pacific Black Duck. The blue lines show the seasonal reporting rate for the twelve months to June 2017 and the bars show the average seasonal reporting rate for the period 1982 to 2017. 
Reporting rate data
| Month | Season | ||||||||||||||||||
|---|---|---|---|---|---|---|---|---|---|---|---|---|---|---|---|---|---|---|---|
| Period | Jul | Aug | Sep | Oct | Nov | Dec | Jan | Feb | Mar | Apr | May | Jun | Winter | Spring | Summer | Autumn | All | ||
| All years | |||||||||||||||||||
| All | 19.2 | 22.7 | 20.2 | 21.8 | 21.7 | 18.8 | 24.5 | 25.1 | 18.1 | 19.6 | 21.6 | 15.4 | 18.7 | 21.3 | 22.7 | 19.5 | 20.7 | ||
| Previous years | |||||||||||||||||||
| All previous years | 19.1 | 23.3 | 20.2 | 21.9 | 21.7 | 18.3 | 24.6 | 24.5 | 16.7 | 18.6 | 21.7 | 14.7 | 18.6 | 21.3 | 22.3 | 18.7 | 20.4 | ||
| Previous 30 years | 18.9 | 22.6 | 19.8 | 21.5 | 21.2 | 17.6 | 24.4 | 23.6 | 16.5 | 17.7 | 21.3 | 13.8 | 17.9 | 20.9 | 21.7 | 18.1 | 19.8 | ||
| Previous 20 years | 18.0 | 21.6 | 18.1 | 20.2 | 20.0 | 15.6 | 24.4 | 22.8 | 15.3 | 15.8 | 20.6 | 11.6 | 16.3 | 19.5 | 20.8 | 16.7 | 18.5 | ||
| 10 year groups | |||||||||||||||||||
| [2007,2017) | 21.0 | 24.0 | 19.9 | 20.7 | 23.4 | 18.4 | 26.3 | 25.0 | 17.4 | 16.9 | 22.8 | 13.9 | 18.7 | 21.1 | 23.3 | 18.5 | 20.6 | ||
| [1997,2007) | 12.8 | 16.3 | 14.4 | 18.5 | 13.2 | 10.3 | 17.9 | 17.2 | 10.7 | 12.8 | 15.3 | 6.8 | 11.2 | 15.4 | 14.4 | 12.5 | 13.5 | ||
| [1987,1997) | 22.0 | 25.8 | 28.5 | 29.4 | 25.2 | 28.8 | 24.3 | 27.2 | 23.3 | 27.7 | 23.8 | 24.5 | 24.2 | 27.6 | 26.7 | 25.0 | 26.0 | ||
| 5 year groups | |||||||||||||||||||
| [2012,2017) | 23.8 | 25.9 | 22.7 | 22.3 | 25.4 | 22.0 | 27.4 | 26.3 | 19.9 | 20.2 | 24.2 | 17.6 | 22.0 | 23.2 | 25.5 | 21.1 | 23.1 | ||
| [2007,2012) | 13.0 | 17.0 | 13.8 | 17.9 | 17.8 | 10.6 | 22.3 | 19.5 | 10.6 | 9.5 | 18.6 | 7.1 | 10.7 | 16.8 | 16.6 | 11.9 | 14.4 | ||
| [2002,2007) | 12.1 | 16.3 | 14.7 | 18.1 | 13.2 | 10.7 | 21.3 | 18.6 | 11.3 | 15.1 | 17.2 | 5.8 | 10.5 | 15.5 | 15.8 | 14.0 | 14.1 | ||
| [1997,2002) | 13.8 | 16.3 | 14.0 | 18.9 | 13.3 | 9.8 | 14.0 | 15.7 | 9.7 | 10.1 | 13.0 | 8.1 | 12.2 | 15.3 | 12.8 | 10.6 | 12.9 | ||
| [1992,1997) | 24.9 | 18.3 | 23.4 | 25.1 | 23.6 | 24.0 | 26.9 | 22.9 | 22.5 | 24.4 | 23.4 | 17.3 | 19.8 | 24.1 | 24.8 | 23.4 | 23.1 | ||
| [1987,1992) | 20.7 | 29.8 | 31.0 | 31.8 | 25.9 | 30.8 | 22.8 | 28.8 | 23.7 | 29.6 | 24.0 | 28.7 | 26.5 | 29.4 | 27.6 | 25.8 | 27.5 | ||
| Year | |||||||||||||||||||
| 2017 | 19.6 | 19.2 | 20.6 | 21.2 | 21.7 | 21.7 | 24.3 | 28.0 | 26.0 | 25.5 | 21.2 | 19.3 | 19.4 | 21.2 | 24.7 | 24.3 | 22.7 | ||
| 2016 | 23.8 | 26.7 | 24.5 | 23.5 | 27.7 | 22.0 | 24.4 | 24.5 | 19.7 | 22.0 | 25.1 | 18.0 | 22.9 | 24.9 | 23.7 | 21.9 | 23.4 | ||
| 2015 | 26.1 | 29.5 | 26.1 | 23.8 | 23.9 | 22.8 | 21.9 | 23.3 | 19.4 | 15.1 | 21.6 | 16.0 | 22.4 | 24.5 | 22.6 | 18.4 | 22.1 | ||
| 2014 | 27.9 | 23.1 | 20.0 | 21.7 | 22.2 | 20.5 | 35.7 | 32.6 | 21.4 | 21.7 | 23.2 | 20.1 | 22.6 | 21.3 | 31.7 | 21.9 | 24.8 | ||
| 2013 | 25.5 | 30.3 | 23.3 | 21.6 | 32.3 | 22.3 | 34.7 | 30.2 | 21.0 | 25.1 | 27.2 | 15.9 | 23.3 | 25.0 | 28.7 | 23.8 | 25.6 | ||
| 2012 | 16.2 | 15.7 | 13.9 | 19.5 | 18.3 | 21.3 | 25.6 | 26.8 | 17.9 | 17.1 | 25.7 | 18.7 | 17.0 | 17.7 | 24.4 | 19.2 | 19.6 | ||
| 2011 | 17.1 | 16.0 | 13.6 | 14.9 | 13.9 | 16.7 | 21.9 | 20.1 | 9.4 | 9.7 | 13.8 | 7.0 | 11.0 | 14.4 | 19.5 | 10.8 | 14.2 | ||
| 2010 | 8.3 | 13.2 | 17.2 | 18.7 | 15.3 | 12.0 | 23.2 | 18.8 | 7.1 | 9.8 | 18.6 | 6.1 | 8.3 | 17.6 | 17.1 | 10.2 | 14.1 | ||
| 2009 | 15.8 | 30.2 | 12.8 | 14.9 | 14.7 | 7.4 | 26.0 | 18.3 | 14.9 | 7.8 | 16.8 | 5.0 | 13.6 | 14.3 | 16.3 | 12.4 | 14.1 | ||
| 2008 | 9.0 | 16.5 | 16.9 | 20.3 | 22.8 | 7.2 | 26.2 | 20.4 | 10.2 | 7.8 | 20.7 | 9.8 | 11.2 | 19.7 | 15.6 | 10.8 | 15.2 | ||
| 2007 | 14.3 | 11.1 | 7.9 | 21.0 | 25.0 | 7.0 | 18.1 | 19.1 | 12.3 | 13.2 | 29.3 | 7.8 | 9.7 | 17.9 | 13.3 | 16.2 | 14.8 | ||
| 2006 | 13.2 | 19.4 | 17.2 | 20.2 | 14.3 | 7.8 | 30.3 | 28.9 | 16.7 | 21.5 | 22.5 | 5.7 | 10.7 | 18.1 | 21.7 | 19.2 | 17.6 | ||
| 2005 | 10.3 | 15.0 | 13.8 | 12.7 | 19.3 | 10.8 | 16.3 | 16.3 | 11.7 | 13.1 | 18.9 | 5.7 | 8.9 | 14.8 | 13.4 | 14.5 | 13.1 | ||
| 2004 | 15.5 | 19.1 | 15.4 | 19.8 | 12.2 | 11.1 | 17.6 | 18.2 | 9.3 | 9.9 | 14.6 | 8.6 | 14.5 | 15.8 | 14.8 | 10.7 | 14.0 | ||
| 2003 | 17.1 | 15.8 | 16.9 | 19.2 | 14.2 | 10.6 | 14.8 | 17.0 | 7.6 | 14.7 | 13.2 | 3.7 | 11.5 | 16.7 | 13.7 | 11.6 | 13.6 | ||
| 2002 | 4.6 | 11.9 | 10.0 | 16.7 | 7.5 | 12.1 | 25.2 | 13.2 | 8.2 | 16.1 | 14.1 | 5.4 | 6.7 | 11.7 | 15.5 | 12.1 | 11.8 | ||
| 2001 | 10.2 | 10.8 | 11.3 | 16.0 | 14.2 | 6.5 | 11.0 | 14.4 | 8.1 | 8.3 | 9.2 | 5.4 | 8.8 | 13.4 | 10.1 | 8.5 | 10.3 | ||
| 2000 | 11.1 | 19.0 | 14.9 | 19.8 | 16.7 | 8.7 | 14.5 | 15.2 | 10.6 | 11.1 | 15.5 | 8.1 | 12.5 | 17.2 | 12.4 | 11.7 | 13.5 | ||
| 1999 | 23.5 | 17.5 | 13.2 | 15.1 | 12.3 | 16.9 | 16.1 | 15.7 | 11.4 | 9.8 | 14.2 | 12.1 | 14.8 | 13.6 | 16.2 | 11.7 | 13.9 | ||
| 1998 | 10.8 | 15.1 | 13.8 | 15.2 | 7.1 | 8.5 | 20.6 | 17.0 | 5.4 | 12.8 | 25.9 | 10.7 | 12.1 | 11.9 | 14.1 | 10.7 | 12.3 | ||
| 1997 | 24.1 | 24.1 | 21.8 | 38.2 | 12.8 | 12.5 | 9.8 | 21.1 | 20.0 | 11.0 | 8.9 | 1.4 | 16.6 | 22.4 | 14.2 | 12.4 | 17.1 | ||
| 1996 | 19.4 | 19.1 | 22.7 | 18.4 | 21.3 | 21.2 | 28.2 | 11.8 | 11.8 | 23.4 | 29.3 | 20.7 | 19.8 | 20.5 | 20.9 | 19.6 | 20.3 | ||
| 1995 | 29.0 | 17.8 | 11.7 | 19.5 | 16.4 | 23.0 | 25.7 | 23.8 | 31.6 | 25.0 | 23.4 | 13.8 | 19.9 | 16.4 | 24.3 | 26.8 | 21.4 | ||
| 1994 | 25.5 | 19.5 | 39.7 | 22.1 | 21.3 | 26.1 | 30.9 | 24.1 | 26.1 | 19.8 | 21.2 | 14.6 | 18.9 | 25.9 | 27.3 | 22.1 | 23.4 | ||
| 1993 | 18.4 | 17.9 | 17.7 | 46.7 | 34.8 | 28.3 | 24.5 | 31.2 | 18.5 | 30.0 | 15.6 | 21.7 | 19.4 | 34.0 | 27.6 | 20.6 | 25.1 | ||
| 1992 | 29.2 | 16.7 | 29.4 | 28.7 | 31.9 | 25.4 | 24.1 | 36.6 | 25.4 | 28.8 | 28.9 | 16.7 | 21.2 | 29.9 | 27.8 | 27.7 | 26.9 | ||
| 1991 | 11.8 | 21.3 | 18.6 | 20.4 | 25.8 | 18.9 | 33.9 | 34.0 | 20.6 | 32.2 | 32.8 | 36.0 | 19.6 | 21.7 | 27.8 | 28.4 | 23.6 | ||
| 1990 | 25.2 | 22.2 | 23.7 | 21.4 | 19.6 | 36.1 | 18.1 | 28.2 | 19.3 | 27.4 | 19.2 | 27.6 | 24.3 | 21.5 | 27.4 | 22.0 | 23.7 | ||
| 1989 | 26.0 | 34.9 | 34.9 | 36.9 | 28.3 | 38.7 | 19.7 | 29.4 | 24.4 | 33.8 | 27.0 | 32.1 | 31.2 | 33.8 | 29.9 | 28.7 | 31.0 | ||
| 1988 | 16.8 | 32.8 | 36.0 | 32.8 | 26.3 | 28.2 | 19.1 | 25.1 | 22.3 | 29.9 | 23.2 | 25.1 | 25.3 | 31.0 | 24.1 | 25.0 | 26.6 | ||
| 1987 | 45.5 | 46.7 | 30.8 | 34.0 | 26.3 | 27.0 | 28.2 | 30.0 | 27.3 | 25.9 | 21.8 | 27.9 | 30.0 | 30.0 | 28.5 | 25.0 | 28.1 | ||
| 1986 | 46.2 | 39.5 | 50.9 | 83.3 | 59.6 | 61.8 | 60.9 | 66.7 | 64.5 | 62.7 | 62.1 | 48.6 | 44.4 | 62.5 | 63.4 | 63.1 | 58.8 | ||
| 1985 | 20.0 | 53.3 | 38.5 | 23.3 | 26.3 | 41.7 | 87.5 | 88.2 | 54.5 | 78.9 | 60.0 | 57.1 | 43.2 | 28.2 | 55.3 | 67.5 | 40.9 | ||
| 1984 | 40.0 | 90.0 | 20.0 | 75.0 | 100.0 | 83.3 | 20.7 | 66.7 | 7.4 | 73.5 | 29.0 | 82.4 | 79.6 | 66.7 | 51.4 | 39.1 | 53.8 | ||
| 1983 | 66.7 | 83.3 | 80.0 | 100.0 | 100.0 | 84.6 | 50.0 | 90.9 | 50.0 | - | 66.7 | 54.5 | 69.0 | 96.3 | 80.0 | 64.3 | 79.0 | ||
| 1982 | - | 72.7 | - | 0.0 | 87.5 | 78.6 | - | 100.0 | - | 100.0 | - | 85.7 | 80.0 | 77.8 | 88.0 | 100.0 | 86.1 | ||
Breeding data
Breeding records by month
Number of breeding records by breeding code and month, 2017 and all years| Breeding code | Jul | Aug | Sep | Oct | Nov | Dec | Jan | Feb | Mar | Apr | May | Jun |
|---|---|---|---|---|---|---|---|---|---|---|---|---|
| 2017 | ||||||||||||
| Breeding (BLA code) | 0 | 0 | 0 | 0 | 0 | 0 | 0 | 0 | 0 | 0 | 0 | 0 |
| Carrying Food | 0 | 0 | 0 | 0 | 1 | 0 | 0 | 0 | 0 | 0 | 0 | 0 |
| Copulating | 0 | 0 | 0 | 0 | 0 | 0 | 0 | 0 | 0 | 0 | 0 | 0 |
| Display | 0 | 1 | 2 | 1 | 0 | 0 | 0 | 1 | 0 | 1 | 0 | 0 |
| Dependent young | 0 | 1 | 18 | 58 | 40 | 29 | 41 | 14 | 1 | 0 | 0 | 0 |
| Faecal sac | 0 | 0 | 0 | 0 | 0 | 0 | 0 | 0 | 0 | 0 | 0 | 0 |
| Inspecting hollow | 0 | 0 | 0 | 1 | 0 | 0 | 0 | 0 | 0 | 0 | 0 | 0 |
| Nest building | 0 | 0 | 0 | 0 | 0 | 0 | 0 | 0 | 0 | 0 | 0 | 0 |
| Nest with eggs | 0 | 0 | 0 | 0 | 0 | 0 | 0 | 0 | 0 | 0 | 0 | 0 |
| Nest with young | 0 | 0 | 0 | 0 | 0 | 0 | 0 | 0 | 0 | 0 | 0 | 0 |
| On/leaving nest | 0 | 0 | 0 | 0 | 0 | 0 | 1 | 0 | 0 | 0 | 0 | 0 |
| All years | ||||||||||||
| Breeding (BLA code) | 1 | 1 | 6 | 19 | 21 | 19 | 34 | 9 | 1 | 3 | 3 | 0 |
| Carrying Food | 0 | 0 | 0 | 0 | 1 | 0 | 0 | 0 | 0 | 0 | 0 | 0 |
| Copulating | 1 | 2 | 0 | 1 | 0 | 1 | 0 | 0 | 0 | 0 | 0 | 0 |
| Display | 0 | 3 | 4 | 1 | 0 | 0 | 0 | 1 | 3 | 3 | 0 | 1 |
| Dependent young | 6 | 10 | 52 | 247 | 173 | 139 | 107 | 55 | 12 | 5 | 10 | 3 |
| Faecal sac | 0 | 0 | 0 | 0 | 0 | 0 | 0 | 0 | 0 | 0 | 0 | 0 |
| Inspecting hollow | 0 | 0 | 3 | 3 | 2 | 0 | 0 | 0 | 0 | 0 | 0 | 0 |
| Nest building | 0 | 1 | 2 | 8 | 7 | 2 | 2 | 5 | 0 | 0 | 0 | 0 |
| Nest with eggs | 0 | 0 | 5 | 4 | 6 | 4 | 0 | 0 | 0 | 0 | 0 | 0 |
| Nest with young | 0 | 0 | 0 | 2 | 0 | 0 | 0 | 0 | 0 | 0 | 0 | 0 |
| On/leaving nest | 0 | 0 | 2 | 9 | 0 | 1 | 1 | 1 | 0 | 0 | 0 | 0 |
Breeding records by year
Average number of breeding records per period by breeding code| Period | Breeding (BLA code) | Carrying Food | Copulating | Display | Dependent young | Faecal sac | Inspecting hollow | Nest building | Nest with eggs | Nest with young | On/leaving nest |
|---|---|---|---|---|---|---|---|---|---|---|---|
| All years | |||||||||||
| All | 3.2 | 0.0 | 0.1 | 0.4 | 22.8 | 0.0 | 0.2 | 0.8 | 0.5 | 0.1 | 0.4 |
| Previous years | |||||||||||
| All previous years | 3.3 | 0.0 | 0.1 | 0.3 | 17.6 | 0.0 | 0.2 | 0.8 | 0.5 | 0.1 | 0.4 |
| Previous 30 years | 3.9 | 0.0 | 0.1 | 0.3 | 19.6 | 0.0 | 0.2 | 0.9 | 0.6 | 0.1 | 0.4 |
| Previous 20 years | 5.5 | 0.0 | 0.2 | 0.5 | 20.1 | 0.0 | 0.3 | 0.0 | 0.4 | 0.1 | 0.6 |
| 10 year groups | |||||||||||
| [2007,2017) | 7.5 | 0.0 | 0.2 | 0.9 | 29.2 | 0.0 | 0.3 | 0.0 | 0.4 | 0.2 | 0.8 |
| [1997,2007) | 3.5 | 0.0 | 0.2 | 0.1 | 11.0 | 0.0 | 0.4 | 0.0 | 0.4 | 0.0 | 0.3 |
| [1987,1997) | 0.7 | 0.0 | 0.0 | 0.0 | 18.7 | 0.0 | 0.0 | 2.7 | 1.0 | 0.0 | 0.2 |
| 5 year groups | |||||||||||
| [2012,2017) | 7.0 | 0.0 | 0.2 | 1.2 | 39.4 | 0.0 | 0.2 | 0.0 | 0.6 | 0.4 | 0.8 |
| [2007,2012) | 8.0 | 0.0 | 0.2 | 0.6 | 19.0 | 0.0 | 0.4 | 0.0 | 0.2 | 0.0 | 0.8 |
| [2002,2007) | 2.4 | 0.0 | 0.0 | 0.2 | 11.6 | 0.0 | 0.6 | 0.0 | 0.2 | 0.0 | 0.2 |
| [1997,2002) | 4.6 | 0.0 | 0.4 | 0.0 | 10.4 | 0.0 | 0.2 | 0.0 | 0.6 | 0.0 | 0.4 |
| [1992,1997) | 1.4 | 0.0 | 0.0 | 0.0 | 6.8 | 0.0 | 0.0 | 0.0 | 0.2 | 0.0 | 0.2 |
| [1987,1992) | 0.0 | 0.0 | 0.0 | 0.0 | 30.6 | 0.0 | 0.0 | 5.4 | 1.8 | 0.0 | 0.2 |
| Year | |||||||||||
| 2017 | 0.0 | 1.0 | 0.0 | 6.0 | 202.0 | 0.0 | 1.0 | 0.0 | 0.0 | 0.0 | 1.0 |
| 2016 | 0.0 | 0.0 | 1.0 | 5.0 | 83.0 | 0.0 | 1.0 | 0.0 | 3.0 | 1.0 | 2.0 |
| 2015 | 1.0 | 0.0 | 0.0 | 1.0 | 62.0 | 0.0 | 0.0 | 0.0 | 0.0 | 0.0 | 2.0 |
| 2014 | 1.0 | 0.0 | 0.0 | 0.0 | 25.0 | 0.0 | 0.0 | 0.0 | 0.0 | 0.0 | 0.0 |
| 2013 | 6.0 | 0.0 | 0.0 | 0.0 | 17.0 | 0.0 | 0.0 | 0.0 | 0.0 | 1.0 | 0.0 |
| 2012 | 27.0 | 0.0 | 0.0 | 0.0 | 10.0 | 0.0 | 0.0 | 0.0 | 0.0 | 0.0 | 0.0 |
| 2011 | 15.0 | 0.0 | 0.0 | 0.0 | 32.0 | 0.0 | 1.0 | 0.0 | 1.0 | 0.0 | 2.0 |
| 2010 | 8.0 | 0.0 | 0.0 | 2.0 | 20.0 | 0.0 | 0.0 | 0.0 | 0.0 | 0.0 | 2.0 |
| 2009 | 12.0 | 0.0 | 1.0 | 0.0 | 11.0 | 0.0 | 0.0 | 0.0 | 0.0 | 0.0 | 0.0 |
| 2008 | 0.0 | 0.0 | 0.0 | 0.0 | 15.0 | 0.0 | 0.0 | 0.0 | 0.0 | 0.0 | 0.0 |
| 2007 | 5.0 | 0.0 | 0.0 | 1.0 | 17.0 | 0.0 | 1.0 | 0.0 | 0.0 | 0.0 | 0.0 |
| 2006 | 3.0 | 0.0 | 0.0 | 0.0 | 15.0 | 0.0 | 2.0 | 0.0 | 1.0 | 0.0 | 1.0 |
| 2005 | 5.0 | 0.0 | 0.0 | 0.0 | 15.0 | 0.0 | 0.0 | 0.0 | 0.0 | 0.0 | 0.0 |
| 2004 | 2.0 | 0.0 | 0.0 | 0.0 | 8.0 | 0.0 | 0.0 | 0.0 | 0.0 | 0.0 | 0.0 |
| 2003 | 0.0 | 0.0 | 0.0 | 1.0 | 10.0 | 0.0 | 1.0 | 0.0 | 0.0 | 0.0 | 0.0 |
| 2002 | 2.0 | 0.0 | 0.0 | 0.0 | 10.0 | 0.0 | 0.0 | 0.0 | 0.0 | 0.0 | 0.0 |
| 2001 | 9.0 | 0.0 | 1.0 | 0.0 | 10.0 | 0.0 | 1.0 | 0.0 | 0.0 | 0.0 | 2.0 |
| 2000 | 3.0 | 0.0 | 1.0 | 0.0 | 19.0 | 0.0 | 0.0 | 0.0 | 2.0 | 0.0 | 0.0 |
| 1999 | 7.0 | 0.0 | 0.0 | 0.0 | 11.0 | 0.0 | 0.0 | 0.0 | 0.0 | 0.0 | 0.0 |
| 1998 | 0.0 | 0.0 | 0.0 | 0.0 | 2.0 | 0.0 | 0.0 | 0.0 | 1.0 | 0.0 | 0.0 |
| 1997 | 4.0 | 0.0 | 0.0 | 0.0 | 10.0 | 0.0 | 0.0 | 0.0 | 0.0 | 0.0 | 0.0 |
| 1996 | 4.0 | 0.0 | 0.0 | 0.0 | 8.0 | 0.0 | 0.0 | 0.0 | 0.0 | 0.0 | 0.0 |
| 1995 | 3.0 | 0.0 | 0.0 | 0.0 | 6.0 | 0.0 | 0.0 | 0.0 | 0.0 | 0.0 | 1.0 |
| 1994 | 0.0 | 0.0 | 0.0 | 0.0 | 1.0 | 0.0 | 0.0 | 0.0 | 0.0 | 0.0 | 0.0 |
| 1993 | 0.0 | 0.0 | 0.0 | 0.0 | 13.0 | 0.0 | 0.0 | 0.0 | 1.0 | 0.0 | 0.0 |
| 1992 | 0.0 | 0.0 | 0.0 | 0.0 | 6.0 | 0.0 | 0.0 | 0.0 | 0.0 | 0.0 | 0.0 |
| 1991 | 0.0 | 0.0 | 0.0 | 0.0 | 8.0 | 0.0 | 0.0 | 0.0 | 0.0 | 0.0 | 0.0 |
| 1990 | 0.0 | 0.0 | 0.0 | 0.0 | 18.0 | 0.0 | 0.0 | 0.0 | 1.0 | 0.0 | 0.0 |
| 1989 | 0.0 | 0.0 | 0.0 | 0.0 | 60.0 | 0.0 | 0.0 | 8.0 | 1.0 | 0.0 | 1.0 |
| 1988 | 0.0 | 0.0 | 0.0 | 0.0 | 35.0 | 0.0 | 0.0 | 8.0 | 1.0 | 0.0 | 0.0 |
| 1987 | 0.0 | 0.0 | 0.0 | 0.0 | 32.0 | 0.0 | 0.0 | 11.0 | 6.0 | 0.0 | 0.0 |
| 1986 | 0.0 | 0.0 | 1.0 | 0.0 | 6.0 | 0.0 | 0.0 | 0.0 | 0.0 | 0.0 | 0.0 |
| 1985 | 0.0 | 0.0 | 0.0 | 0.0 | 4.0 | 0.0 | 0.0 | 0.0 | 0.0 | 0.0 | 0.0 |
| 1984 | 0.0 | 0.0 | 0.0 | 0.0 | 10.0 | 0.0 | 0.0 | 0.0 | 0.0 | 0.0 | 0.0 |
| 1983 | 0.0 | 0.0 | 0.0 | 0.0 | 2.0 | 0.0 | 0.0 | 0.0 | 0.0 | 0.0 | 0.0 |
| 1982 | 0.0 | 0.0 | 0.0 | 0.0 | 6.0 | 0.0 | 0.0 | 0.0 | 1.0 | 0.0 | 0.0 |
Distribution map
Distribution - 2017
This map shows the observed distribution of the Pacific Black Duck for 2017.
The red circles are the grid cells where Pacific Black Duck have been reported.
The transparency of the red circles indicate how many surveys sheets were submitted for that grid cell; the darker the red the more reliable the data. Of the 315 grid cells with reports, 83 had only one sheet; an example is grid number A9.
The size of the circle represents the reporting rate. The maximum reporting rate for Pacific Black Duck was 100.0% (eg grid number A9) and the minimum was 0.6% (eg grid number J11). 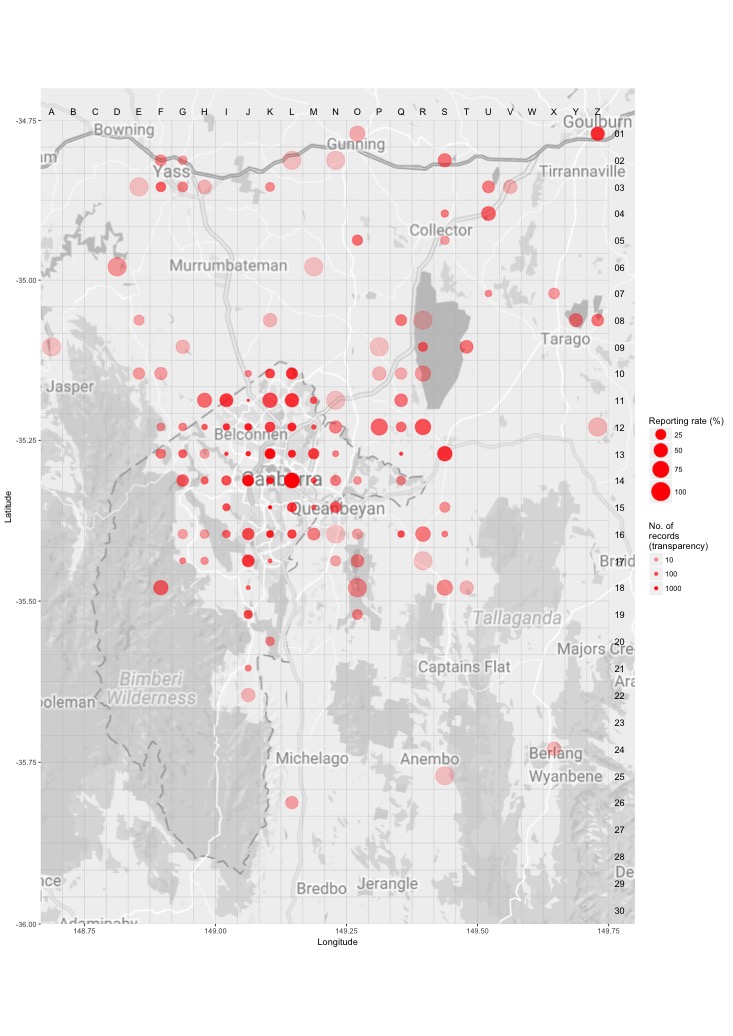
Distribution - all years
This map shows the observed distribution of the Pacific Black Duck for all years.
The red circles are the grid cells where Pacific Black Duck have been reported.
The transparency of the red circles indicate how many surveys sheets were submitted for that grid cell; the darker the red the more reliable the data. Of the 703 grid cells with reports, 55 had only one sheet; an example is grid number B5.
The size of the circle represents the reporting rate. The maximum reporting rate for Pacific Black Duck was 100.0% (eg grid number B5) and the minimum was 0.4% (eg grid number E15). 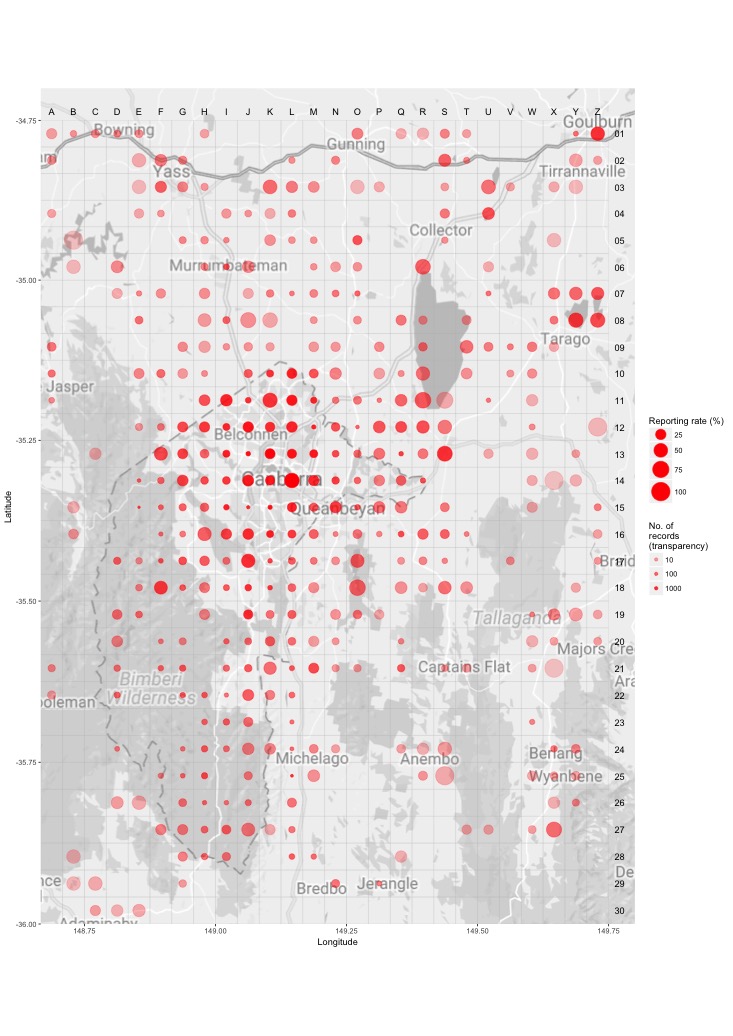
Breeding map
Breeding - 2017
This map shows the breeding distribution of the Pacific Black Duck for 2017.
The red circles are the grid cells where breeding activity for Pacific Black Duck have been reported.
The size of the circle represents the number of reports. 
Breeding - all years
This map shows the breeding distribution of the Pacific Black Duck for all years.
The red circles are the grid cells where breeding activity for Pacific Black Duck have been reported.
The size of the circle represents the number of reports. 